
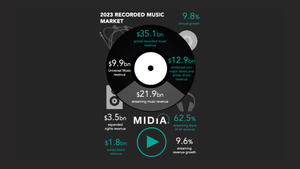
In what’s becoming another hotly anticipated annual stats drop for the music industry - and one which takes place just before IFPI publishes its Global Music Report - London-based analyst firm MIDiA has released its own equally comprehensive look at the global recorded music market. Its analysis shows that global recorded music revenues reached $35.1 billion in 2023, a 9.8% increase from the global total it reported for 2022 of $31.2 billion.
A quick side note - if you’re a nerd, you’ll immediately have done that calculation in your head and realised that 9.8% uplift on $31.2 billion doesn’t come to $35.1 billion. This is because of a slight adjustment to historical figures, “as MIDiA factored in some additional South Korean label revenue that had not previously been captured, particularly expanded rights revenue from these labels”.
Another thing that may well jump out to you, if you’re the type of person who tracks these sorts of numbers, is that the MIDiA figure for 2022, $31.2 billion, is significantly different to IFPI’s 2022 figure of $26.2 billion. So where did MIDiA find an additional $5 billion in 2022? And is this difference in numbers between the MIDiA and IFPI reports likely to be repeated with 2023 data?
In a detailed call with CMU on the day MIDiA published its report, MIDiA MD and music industry analyst Mark Mulligan ran us through some of the key numbers, and helped us understand some of the main differences in methodology between the MIDiA report and IFPI’s similar-but-different numbers. The biggest difference? The way MIDiA deals with “other” revenues.
The majority of record label revenue used to come from physical record sales, then downloads, and now streaming. Key inversion points, according to IFPI’s historic figures, came in 2013/2014 when downloads + streaming overtook physical, and then in 2017/2018 when streaming revenues were greater than physical + downloads. Beyond streams, downloads and physical sales, labels also pull in additional revenues often lumped together in “other”. It is that “other”, says Mulligan, that is really beginning to “pull its weight”.
Critically, for the comparison between the MIDiA and IFPI reports, is the fact that MIDiA’s other includes what Mulligan calls “expanded rights” - the involvement of labels in brand partnerships and merch - which are not accounted for in IFPI’s analysis. It is the rapid growth of expanded rights - which have not traditionally been part of the recorded music business - that is driving an increase in the topline revenue figures that MIDiA reports, and it’s a revenue stream that Mulligan thinks is going to be increasingly important over the next decade.
“Unless you’re an indie artist on Bandcamp selling downloads, or a DJ on Beatport, then the only way you’re able to capture proper fandom at scale is expanded rights and physical”, and so - with the superfan opportunity being talked up more and more by the major labels, and the rest of the record industry following that lead - expanded rights are a critical yardstick for measuring the superfan opportunity.
“Expanded rights and physical are the traditional tools the music business has to monetise superfandom”, says Mulligan. “We’re at a point now where expanded rights are significant enough that we need to be incorporating these in the figures - and if you look forward five years, ten years, it may well be that we look back at 2023 as the first year of the future of the industry. Someone once said - I can’t remember who - something along the lines of, ‘Everything is different but all along it looked the same’, and I think that’s where we are at now”.
(For those who care, that quote is one regularly misattributed to CS Lewis - “Isn’t it funny how day by day nothing changes, but when you look back, everything is different…” - but, in fact, comes from a Calvin and Hobbes cartoon: “Day by day nothing seems to change, but pretty soon everything is different”.)
There’s another significant difference between the MIDiA numbers and the IFPI numbers - and that one is far more complex to get your head around.
As we pointed out the other day, making sense of music industry revenue stats is uniquely complicated, and informed by a number of different variables. Making sense of these revenue stats at a global level is even harder - and a big part of that is to do with how companies themselves report revenues, and how different methodologies can be employed to parse and aggregate those numbers into meaningful global statistics.
That doesn’t necessarily mean that there’s a right or a wrong way to do these things - but different approaches can give significantly different results.
One critical complication that has to be taken into account - by MIDiA, by IFPI, and by the companies themselves - is how you deal with reporting revenues in one currency when your business is global and you’re dealing with a whole host of different currencies.
With constantly fluctuating exchange rates, providing a number that has meaning is a significant challenge. For example, Sony Music reports its global revenues in Japanese yen, but significant parts of that revenue are generated in the USA, UK and Europe - so money is coming in as dollars, pounds and euros, and needs to be converted into yen for reporting. Warner reports its revenues in dollars, Universal reports its in euros.
And - of course - at the point global reports are compiled, everything needs to be converted into one “reference” currency to be able to supply aggregated revenue figures.
There’s another challenge here though: exchange rates are constantly changing and sometimes quite significantly. According to the IRS yearly average exchange rates table, in 2019 $1 got you ¥109.008, 2020 it was just ¥106.725, but by 2022 it was ¥131.454 and in 2023 ¥140.511
This means that if Sony made $10 million in revenue in the USA at a particular point in 2019 then it might appear as ¥1.09 billion in revenue. However, if Sony made $10 million in revenue at a particular point in 2023 then it could appear as ¥1.45 billion in 2023. That’s ¥360 million difference - which, at 2023’s exchange rate, is around $2.56 million, whereas at 2019’s exchange rate it’s $3.3 million - nearly three quarters of a million dollars difference.
Of course, we’re not talking about revenues of $10 million - we could be talking about tens, hundreds or even thousands of millions being translated from one currency to another.
Do you do the conversion on the day the revenue was generated, or the month it was reported, or the day a company actually converted from one currency to another? And what if it was never actually converted, but stayed in the US bank account of a European company?
There are various ways this can be approached, which can be broadly defined as “constant currency reporting” vs “current currency” or “transaction currency” or “reporting currency”.
“To portray their businesses in the most favourable light to investors, many corporate organisations grapple with the question of whether to employ constant currency reporting. This approach can be divisive; while some staunchly advocate for it, others oppose it”, says GTreasury, a global finance treasury platform.
Companies themselves will employ one methodology in key financial metrics - but might be required to report in a different way in regulatory filings. Helpfully, there’s an IFRS Standard about how you do all of this. It’s 28 pages of densely written accountancy-speak.
This gets even more complex when you’re trying to analyse numbers that may or may not already have been subject to this sort of conversion.
MIDiA’s report says, “All revenue values referenced in this report are in USD, with all conversions from local currencies calculated by taking the average quarterly exchange rate for each quarter of the year. No constant currency values are used in this report”.
What about IFPI? Well, this is where it gets even more confusing. If you look at IFPI’s Global Music Report published last year, which contains numbers for 2022, IFPI says that the 2021, 2020 and 2019 revenue numbers were $24 billion, $20.3 billion and $18.9 billion respectively. Go back to the previous year’s report and the 2021, 2020 and 2019 numbers published by IFPI are $25.9 billion, $21.9 billion and $20.4 billion.
How can the same number - global music revenue for 2021 - be $24 billion when it was published in 2022, but $25.9 billion when it was published in 2021?
This comes about when companies - or analysts - “restate” numbers, which is a further extension of the constant currency issue. “The calculation of constant currencies varies based on the chosen approach: some organisations opt for the prior year’s average exchange rate, while others adjust previous figures in alignment with the current year’s exchange rate. However, the primary aim remains consistent: demonstrating global performance in a manner that facilitates direct comparisons, eliminating the ups and downs caused by currency fluctuations”, says GTreasury.
By this time tomorrow we will have at least three numbers for the size of the global recorded music market in 2022: MIDiA’s 2022 figure, IFPI’s current 2022 figure, and - after publication of its 2023 numbers - a restatement of the 2022 number in line with the constant currency methodology it employs.
Is one number “more right” than another? Not really. Is one number better suited to a particular purpose than another? Possibly. Is one of those numbers a better reflection of the current state of the industry today? Quite probably.
Check back tomorrow after IFPI publishes its Global Music Report - and then follow along on Friday as we take a more detailed look at the numbers underlying each report.
